AI-Powered Freight Rate Prediction Accuracy
Accuracy depends on data quality and prediction horizon, not algorithm sophistication.
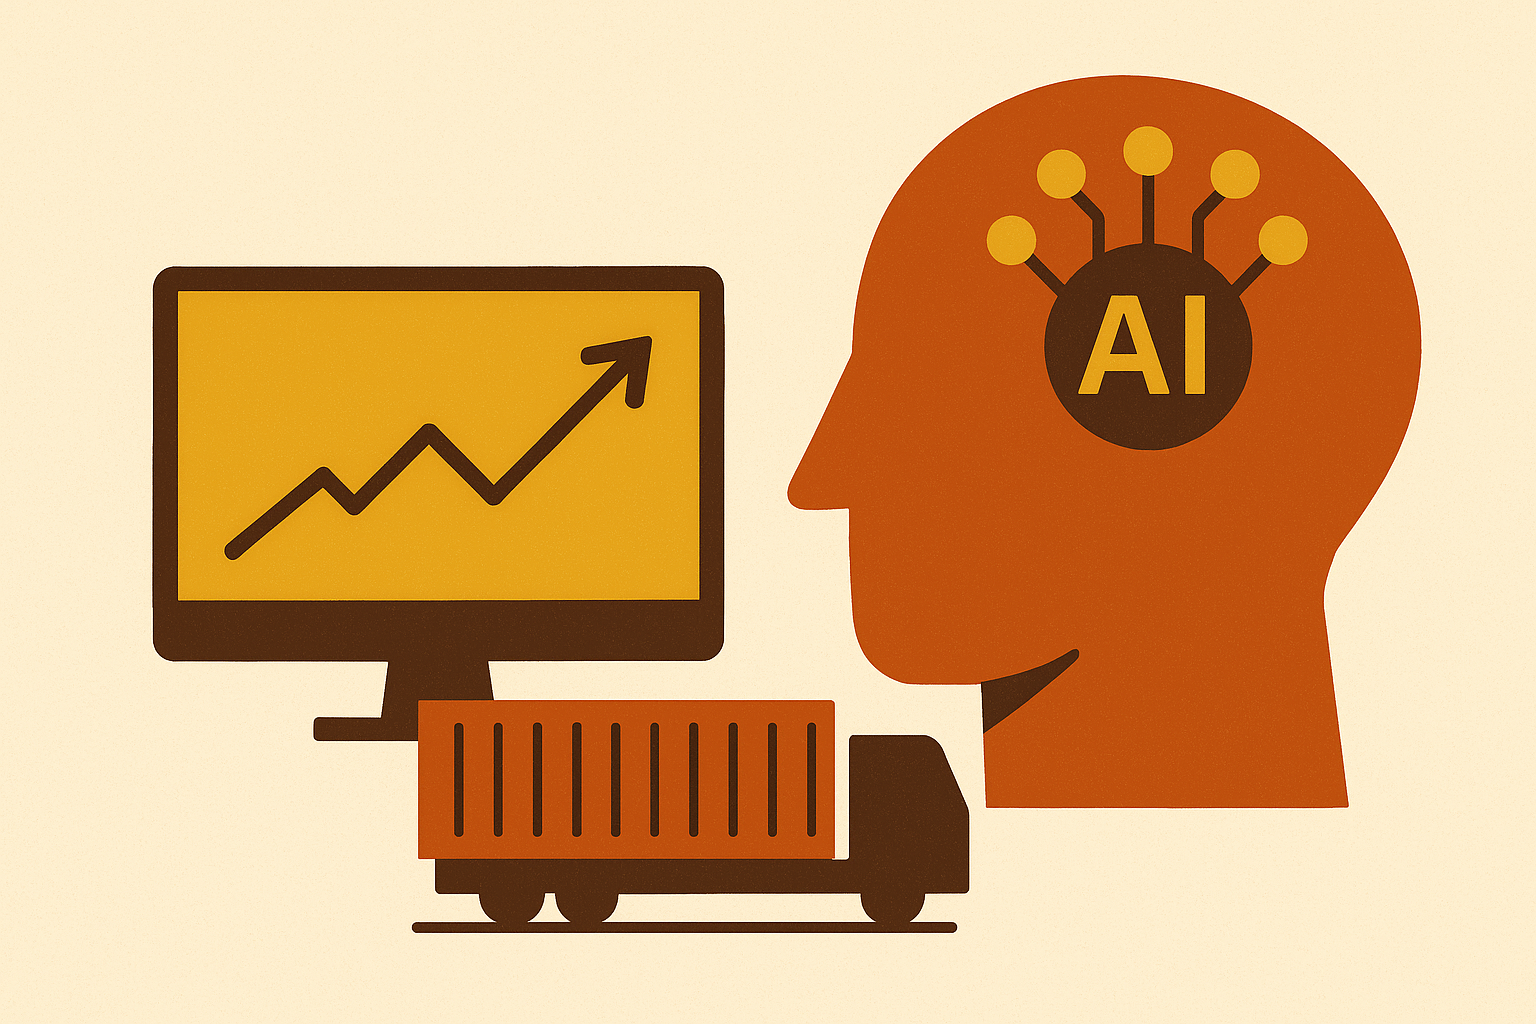
AI-powered freight rate prediction can be genuinely accurate, but it can also be dead wrong while sounding exactly as confident, and the difference between the two has almost nothing to do with how fancy the algorithm is. It comes down to data quality, which variables got picked, and whether anyone bothered to test the model against a market that just fell apart. That last part is where most of the marketing quietly goes silent.
Freight markets don't behave like the clean, bounded problems AI is good at. They behave more like financial markets: chaotic, prone to sudden regime shifts, and only partly visible even to the people trading in them every day. That distinction matters before a single accuracy number gets discussed, because a lot of logistics folks hear "AI" and quietly expect the 97-99% you get from image recognition, where a model tells a cat from a dog without much drama. Freight doesn't work that way, and Dr. Vishal Gupta of USC's Marshall School of Business said as much at the Freightos Stable Chaos summit, bluntly: that level of accuracy "is just not gonna happen" for freight, and he's not wrong to say it.
Why not? Rates move on geopolitics, weather, port congestion, and carrier behavior, all things that show up rarely in historical data and can flip a market overnight. So accuracy in this space isn't some fixed property of the technology. It sits on a spectrum instead, and where a given model lands on that spectrum depends on things a buyer can actually go check.
What the research actually shows about achievable accuracy
Vendor marketing loves the number 90, with prediction accuracy above 90% and demand forecasts above 90% delivered with the confidence of a fact rather than a claim someone made up in a slide deck. Most of these figures don't come with peer review attached, so treat them as marketing copy until proven otherwise.
The peer-reviewed work paints a messier, more honest picture. A 2025 study in MDPI on road freight got a mean absolute percentage error (MAPE) as low as 6.27% using a Gradient Boosting model with evolutionary feature selection. That's a strong result, but it took careful preprocessing and feature engineering built around the specific route, not something you plug in out of the box. A 2025 ScienceDirect comparison of Decision Tree, Random Forest, Prophet, and LSTM models on container routes found Decision Tree beating Random Forest by 91.8% on the U.S. West Coast route under volatile conditions. That's not a rounding error. It means the model architecture itself, not just the data feeding it, can swing results by a wide margin.
A Springer study using North American TransBorder data from 2006 to 2021 found a Multi-Layer Perceptron beating ensemble models with 97% test accuracy, though that was on a structured historical dataset, not a live market, which is a different and easier test. A hybrid SARIMA-BSTS-Prophet model built for the Baltic Dry Index hit a MAPE of 3.54%, beating standalone neural networks and time series methods on their own.
Real deployments sit somewhere in this same range. One global manufacturer running AI across more than 300 freight lanes saw machine learning cut mean squared error by 24.6% and mean absolute error by 29.5% against traditional forecasting. That's an improvement over a baseline, not proof of some ceiling on precision. AsstrA's custom model doubled its freight rate prediction accuracy by combining route, container, and pricing data, again a relative gain, not a fixed target you can copy and paste into your own operation. Put it all together and the takeaway is simple: AI beats traditional forecasting pretty consistently, but what's worth watching is the gap between what vendors claim and what peer-reviewed studies actually measure. That gap is exactly where a buyer should slow down and start asking questions.
How prediction horizon shapes accuracy — and why most buyers want the hardest version
Here's a wrinkle that trips people up: accuracy isn't one number, and it changes depending on how far out you ask the model to look. Deep ensemble learning research on the Baltic Dry Index shows long-term forecasts carry noticeably higher error, across RMSE, MAE, and MAPE, than short-term ones. One-step-ahead forecasts are reliable in a way multi-period forecasts just aren't.
And here's the catch: the forecasts everyone actually wants are the long ones. Procurement teams negotiating contracts want rates weeks or months out, not tomorrow's spot price, so the exact use case that generates the most business value, predicting where rates land for a contract signed in Q3, is precisely where accuracy falls apart the fastest. It's a bit like asking a weather model for tomorrow's forecast and getting a solid answer, then asking for six weeks out and getting something closer to a coin flip with nicer graphics.
Short-horizon models earn their keep on spot pricing and daily quoting, where the data is fresh and the pattern hasn't had time to shift under it. Longer-horizon models need sturdier inputs, and just as important, they need to admit how uncertain they are instead of hiding behind one clean number. So the real question isn't "how accurate is this model." It's "how accurate is this model at the horizon I actually need it for," and vendors don't always volunteer the difference.
The input variables that determine whether a model is useful or misleading
A 2025 systematic review in Maritime Economics & Logistics looked at 28 studies from 2012 to 2024 and counted 59 distinct input variables used across freight rate models, targeting 17 different forecast outcomes. That range tells you something on its own: which variables go into a model isn't dictated by the problem, it's a design choice, and different choices pull different answers out of the same underlying market.
A few categories keep showing up in the models that actually work. Lane-level supply and demand data matters because regions respond to seasonal and economic shifts differently; national averages smooth over the local dynamics that actually move prices, which is why DAT's research leans hard on lane-specific signals rather than broad national trends. Historical transaction data matters too, both volume and how recent it is. C.H. Robinson trains its system on 37 million annual shipments, which buys it lane-level detail that most individual shippers can't match with their own records. The MDPI road freight study found temporal aggregation, temperature constraints, and total transport distance among its strongest predictors, a reminder that the most useful variables are often the least glamorous ones.
Macroeconomic indicators, fuel prices, and carrier capacity utilization belong on the list too, and so does effective capacity and schedule reliability: UNCTAD's 2025 Review of Maritime Transport documents how Red Sea rerouting cut effective shipping capacity and pushed rates toward levels not seen since the COVID peak. Any model missing that input simply missed the move, no matter how elegant its architecture looked otherwise.
There's a newer category worth flagging: sentiment. A 2025 paper in Transport Policy built a shipping sentiment index from over 9,000 iron-ore shipping headlines and found it tracked freight rate moves closely enough to work as an early warning layer, catching shifts before they showed up in price data at all. Architecture matters on top of all this. The Maritime Economics & Logistics review found neural networks are the most common approach, but hybrid and specialized models beat standalone ones often enough to notice. DAT treats its predictive models as things that need constant testing against real market prices, not something you train once and trust forever. A 2024 Springer paper pushes this further, using a reinforcement learning setup that keeps a pool of models running and reweights them by how well each one has predicted lately, instead of freezing one trained model in place and hoping the market cooperates.
Where data quality breaks models that look sophisticated on paper
Dirty data produces dirty results, and it's not a new problem, but AI makes it worse in one specific way: it delivers the dirty results faster, and with more apparent confidence, than a spreadsheet ever managed to.
A few failure modes keep showing up in the literature. Incomplete or stale system logs leave gaps that the model fills in with patterns that may have nothing to do with actual conditions at the time; it just doesn't know the difference and won't tell you it's guessing. Selection bias is bigger than people assume, and the 2025 Springer literature review found 61% of machine learning freight studies focus on dry bulk shipping, so a model trained on that segment generalizes poorly to container freight or trucking without real retraining, not a quick tweak of a few parameters.
Then there's the mismatch in how often data gets collected. That same review found weekly (42.9%) and daily (39.3%) intervals are the most common in training, but plenty of operational decisions need intraday resolution a weekly-trained model can't give you, no matter how good its weekly numbers look on a slide. Survivor bias creeps in quietly too: historical rate data usually reflects completed transactions, not the rejected bids or failed quotes that never closed, which skews what the model thinks "normal" pricing looks like.
Before trusting any accuracy claim, ask what data trained the model, how recent it is, and whether it actually reflects the lanes you run. Uber Freight's Insights AI, trained on $20 billion in freight data, gives some sense of the scale it takes to build something that holds up across genuinely different conditions, not just the one it happened to be trained on.
What black swan events reveal about the hard ceiling on AI freight prediction
The 2025 Maritime Economics & Logistics review says this plainly: geopolitical conflicts, regulatory changes, and sudden supply disruptions reshape markets in ways historical data simply doesn't capture. Machine learning stays a decision-support tool here, not a replacement for someone with judgment and a phone.
The Red Sea disruption is the cleanest recent example. Average 40-foot container prices roughly doubled in a short window as rerouting stretched voyage times and choked off effective capacity. Models trained on pre-disruption data had nothing comparable anywhere in their training set; they weren't wrong so much as they kept answering a question nobody was asking anymore. Port strikes, border closures, sudden regulatory shifts: each one shoves the market into a state the training data has never seen. The dangerous part isn't that AI goes quiet when this happens; it keeps talking, confidently, and a confident wrong answer does more damage than an honest "I don't know" ever could.
Hybrid approaches soften this some. The reinforcement learning model from that 2024 Springer paper, along with the SARIMA-BSTS-Prophet hybrid built for the Baltic Dry Index, both hold up better than pure machine learning during volatile stretches, by blending model types and reweighting them as conditions shift underneath them. Sentiment signals offer a different kind of hedge, catching movement in the news before it shows up in price data. AI narrows uncertainty a lot under normal conditions. When the regime breaks, though, the job of the system is to raise a flag for a human, not to keep confidently steering on its own.
How production systems handle this in practice — and what separates credible platforms from marketing claims
C.H. Robinson runs proprietary algorithms trained on 37 million annual shipments to predict truck capacity and lane volatility, with language models processing over 2,000 quote requests a day in under 30 seconds each. That's a decent illustration of how data scale and tight operational plumbing compound into real accuracy gains, rather than either one doing much on its own.
Uber Freight uses a Markov Decision Process for upfront pricing, layering in XGBoost models that weigh lead time, repeat bookings, and distance. That level of specificity is exactly what the research points to as a sign of a serious model, not a marketing slide. Triumph, through Greenscreens.ai, frames its edge around data connectivity across the Triumph Network, an argument about transaction volume and breadth rather than some claim of a uniquely clever algorithm. DAT Freight & Analytics uses AI-enabled forecasting to catch outliers and account for lane-level supply and demand shifts, with continuous validation against real market prices as the thing that keeps it honest.
So what should a buyer actually check before trusting any of this? Ask what data trained the model, how much there is, how recent it is, and whether it covers your lanes. Ask whether the reported accuracy applies to the horizon and market segment you actually care about, or just to whatever historical window happened to make the model look good. Ask whether the system updates as markets shift or sits frozen the day training ended. Ask whether it shows a range of outcomes or one clean number hiding how uncertain the prediction really is. And ask whether a human gets pulled in when conditions turn volatile, or whether the system just keeps executing on autopilot regardless. These questions apply well outside freight too; any AI system making calls in a live, chaotic market lives or dies on data quality, sensible variable choices, ongoing checks against reality, and a person somewhere in the loop when things get weird.
What logistics decision-makers should actually measure and monitor
Pick the error metric that fits the decision. MAPE is intuitive since it expresses error as a percentage, which travels well across lanes of different sizes, while RMSE punishes big misses harder, which matters when one bad forecast costs far more than a handful of small ones put together. Both show up constantly in the peer-reviewed research, and for good reason: they're answering different questions.
Track accuracy by lane and by horizon separately. An aggregate number can look great while hiding a lane or two that's consistently off, and those are exactly the lanes where someone ends up overpaying without noticing. Insist on backtesting against volatile stretches, not just calm ones; a model that sailed through a quiet 2022 and 2023 but never faced something like the Red Sea disruption hasn't been stress-tested at all, it's just been tested lightly. Watch for model drift too, since markets move and a model trained once and left alone drifts out of calibration; the real question is whether the platform catches that itself or whether you find out the hard way, through a run of bad calls nobody flagged.
Build regime-change triggers into the workflow directly: a sentiment spike, a geopolitical event, a lane rate crossing some threshold, any of these should kick a prediction over to a human for review instead of letting it auto-execute. MHI's 2026 Annual Industry Report puts AI adoption among supply chain companies at 41%, up from 30% the year before, so the pressure to get on board is real and building fast. But adopting a system without these habits just turns AI's speed into a faster way to make expensive mistakes.
The bar was never perfection. It's whether AI's predictions, watched and bounded by human judgment at the edges, lead to better decisions than whatever you were doing before, and whether your organization can actually tell the difference when it counts.