Driver Behavior Monitoring and Fuel Efficiency Gains
Coaching drivers on speed and idling cuts fuel costs without new trucks.
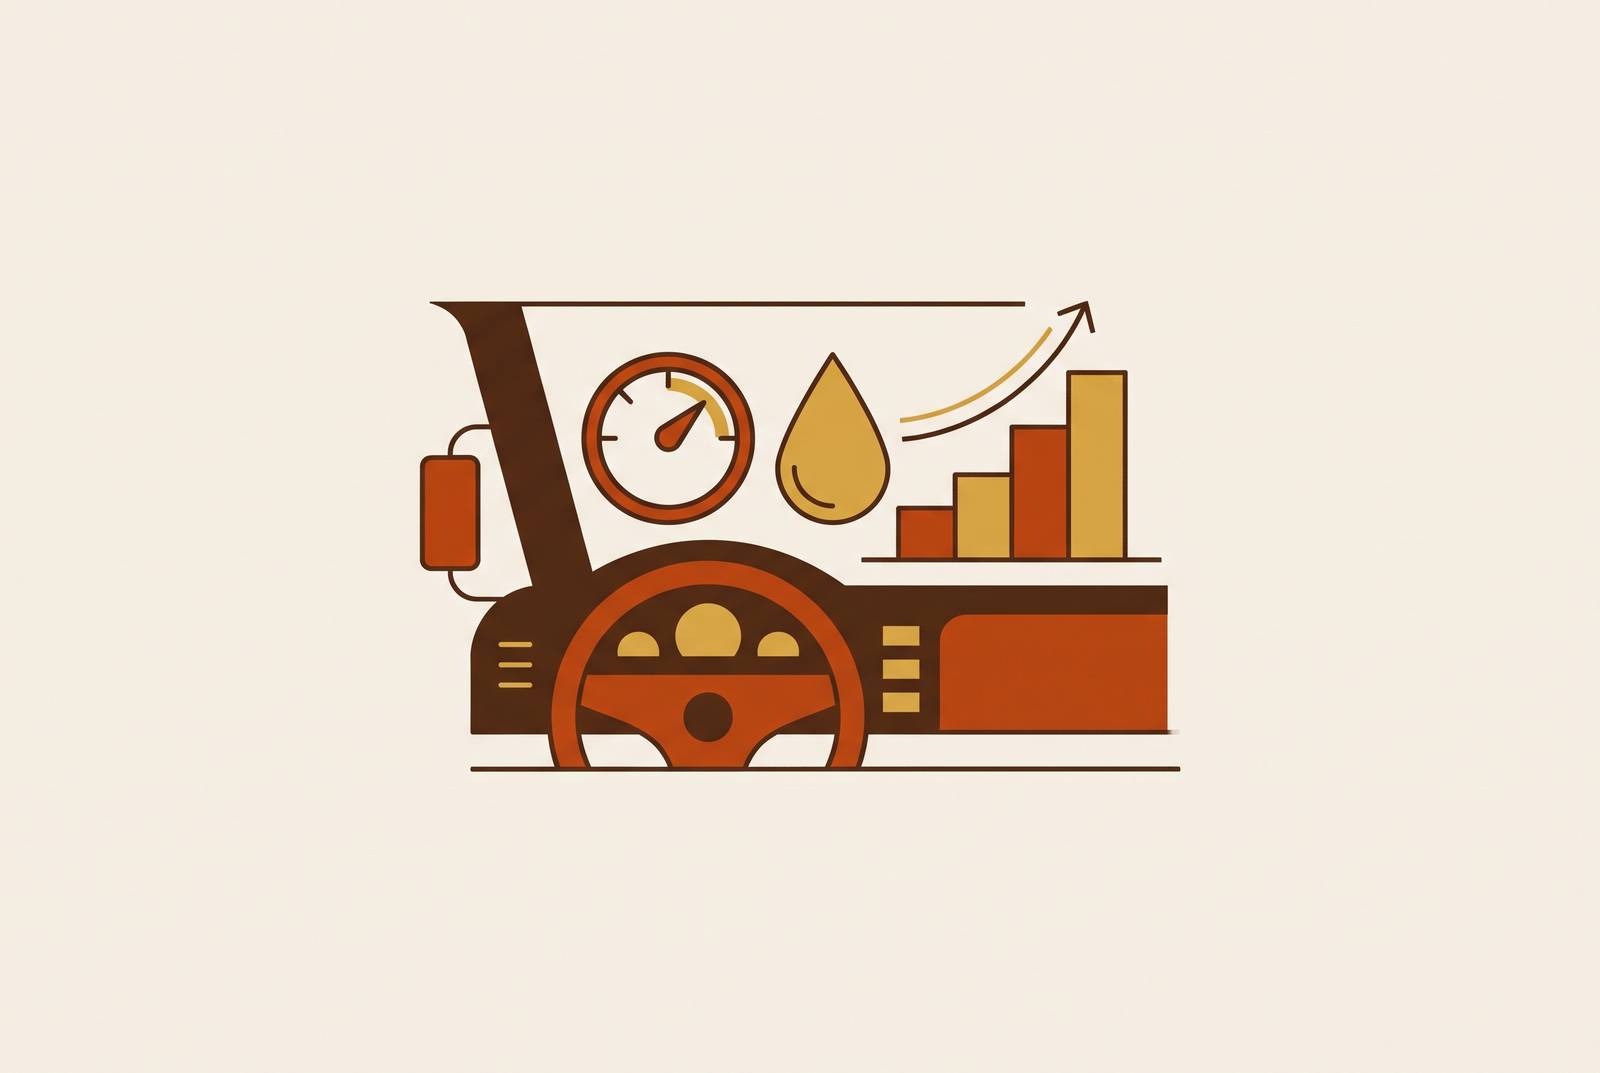
Drivers’ habits, more than trucks or routes, let fleet managers cut fuel costs without spending a dime on new vehicles. That's the main point: behavior makes up as much as a third of the fuel economy difference between vehicles on the same routes in the same fleet, and that difference shrinks quickest not with new trucks but with consistent monitoring and effective coaching.
Begin with the financial impact. Fuel accounts for 30–40% of total fleet operating expenses. FMCSA trucking data falls within a comparable range, between 28% and 38%. ATRI’s 2025 trucking-cost update sets fuel at $0.481 per mile in 2024, 21% of the $2.260-per-mile total marginal cost. None of that is background noise. It's the biggest expense most fleets can still affect without new equipment or long buying processes, which is why the 33% driver-behavior difference is so important: it's the one factor a fleet can alter starting Monday.
The specific behaviors that burn fuel and how much each costs
Aggressive driving, meaning speeding, hard braking, rapid acceleration, cuts fuel economy by 15% to 30% at highway speeds and by as much as 10% to 40% in stop-and-go traffic, according to MIT analysis. The impact of speed warrants separate discussion due to its clear and consistent calculations. Fueleconomy.gov estimates a cost of about $0.29 per gallon equivalent for each 5 mph over 50. Oak Ridge National Laboratory tested 74 light vehicles and saw fuel economy fall 12.4% from 50 to 60 mph, 14% from 60 to 70, and 15.4% from 70 to 80. For heavy trucks, every 1 mph over 55 costs about 0.1 MPG. An owner-operator driving 120,000 miles a year pays $6,000–$8,000 more in fuel annually cruising at 70 mph instead of 60. That's not rounding error. That's a truck payment.
Idling steals quietly, mainly since it yields nothing while the cost keeps adding up. A standard heavy-duty diesel engine consumes roughly a gallon every hour when it's idling. A truck that idles for 8 hours daily, 300 days a year, burns roughly $6,000 worth of fuel without moving an inch. ATRI's 2025 data shows that 30 minutes of daily idle costs $1,000 per truck per year, and fleet-wide, idling can consume 16% to 24% of total fuel costs. Zoom out further and the U.S. The U.S. Department of Energy figures that idling wastes over 6 billion gallons every year for all types of vehicles, and trucks alone waste about 3 billion of them.
Here’s the catch: some of that wasted fuel isn’t the driver’s fault. ATRI's 2024 detention study showed 39.3% of stops had detention over two hours, wasting over 72 million gallons of diesel at shipper and receiver docks. A driver waiting for a dock door isn't wasting fuel because of negligence. This difference is crucial for how we'll design coaching later, as blaming drivers for delays at loading docks they can't control will quickly erode their trust in the program.
Combining speeding and idling worsens the situation. A driver who does both regularly can land at the high end of that 33% variance, and the loss there tends to dwarf most maintenance budgets a fleet actually tracks.
What monitoring systems actually capture and how they identify waste
Telematics hardware gets speed, idle time, acceleration, hard braking, and gear shifts from the truck's CANbus or OBD2 port. The data shows the driver’s actions, not just the truck’s movements. GPS tracking adds to this, linking fuel consumption to particular routes and drivers, allowing a fleet to distinguish between real behavioral waste and other factors.
Granularity turns out to be the whole game. Granularity turns out to be the whole game: precise fuel consumption modeling requires second-by-second driving data. Exact spikes, like hard brakes and sudden starts, are smoothed out by weekly summaries, which actually waste fuel. A report showing “average speed: 62 mph” gives a manager almost no useful insight.
AI dashcams give you live updates, pointing out speeding or sudden lane changes as they occur instead of putting them in next week's report. Driver monitoring tech has advanced quickly, Hyundai Mobis rolled out a system in February 2025, spotting more than ten risky behaviors. New systems launched in 2025 are designed to stay reliable in poor lighting. In 2025, New driver-monitoring systems launched in 2025 aim at fleet safety across the Americas.
Adoption has essentially become a baseline requirement. Teletrac Navman's 2024 survey revealed that 98% of participants use telematics for all or part of their fleet, with 96% noting tangible savings. NACFE’s 2024 Fleet Fuel Study shows fuel-efficiency tech use rose from 17% in 2003 to 42% in 2023, and early adopters saw the largest gains. Early adopters still hold an advantage, though the gap is closing as adoption spreads.
The MPG gap between top fleets and average ones, and what drives it
A 2024 NACFE study found that top-performing fleets, with an average of 7.77 MPG, outpace the national average of 6.9 MPG by 12.6%. Pause to consider that figure for a moment. It's large enough to represent real money at scale, yet small enough that a mid-tier fleet manager can look at it and think "close enough," which is exactly the trap. It's not the nearby competition but complacency that's really cutting into margins here.
What sets the top quartile apart? Three things, mostly. They make speed limits a real rule, not just a breakroom suggestion. They tie idle reduction to accountability rather than a poster that says "please don't idle." And they route real-time data to somebody who acts on it that day, not a dashboard that gets glanced at once a quarter.
Without a response culture, monitoring simply results in an average performance. The data is necessary, sure, but it isn't sufficient on its own, which is exactly why the next question isn't "what does the alert say" but "what happens after it fires."
How structured coaching turns monitoring data into lasting habit change
After initiating event-based coaching, fleets notice better MPG, with the quickest improvements often stemming from addressing the few drivers causing the most harsh braking and speeding. This is the Pareto principle at work: a few outliers typically cause most of the waste.
Effective coaching tends to look pretty specific in practice. Ease up to red lights rather than slamming on the brakes. Stop the engine after 30 seconds of sitting still. Avoid sudden acceleration. This isn't unusual advice, but it's more effective when given right after the event rather than three weeks later in a PDF that goes unread. Feedback right after the event works better than a periodic report, since the driver still remembers the intersection where it happened.
Coaching must distinguish between idling caused by a driver and idling caused by a dock. Mix them up, and a program that doesn’t distinguish detention idling can seem like a driver blamed for a loading delay. This quickly destroys any willingness to comply.
Industry research citing Coaxsoft analytics found that training aimed at specific behaviors flagged by the data, rather than generic "drive safe" advice, cut hard acceleration events sharply and overall fuel consumption by 13%. AI-powered coaching platforms, including Motive, now provide personalized recommendations that target excessive idling and aggressive acceleration, shifting feedback delivery from managers' weekly reviews to immediate system alerts.
Here's the thing worth admitting: most drivers already know what efficient driving looks like. The actual gap is feedback frequency, and whether the driver believes the measurement is fair. If coaching design doesn't address both, it won't succeed at all.
Scorecards, gamification, and incentives as the mechanism that sustains improvement
Gamification, including points and visible progress markers, can boost repeat positive behavior, but only while the program remains active. But this is important: gamification keeps habits going, it doesn't make them stick forever after the points end.
A case worth noting here. One customer experienced a substantial increase in safe driving behavior, leading to reduced collision risk, a meaningful cut in fuel costs, and a notable rise in driver retention. Put together, Geotab reports that added up to a several-hundred-percent return on the program. That number was driven by positive reinforcement, not punishment.
Why is a scorecard more effective than a warning? Because it reframes monitoring from surveillance into feedback. A driver who can see their own rank and understands exactly how it's calculated is far more likely to self-correct between formal coaching sessions than one who just knows a camera is watching. Western Express tied pay bonuses to the AI dashcam’s safety scores, making the numbers a prize drivers aimed for instead of a threat. The cultural framing matters just as much as the metric.
A number of platforms designed for this purpose now exist alongside standard telematics tools: Geotab's MyGeotab featuring its Driver Safety Scorecard, Samsara's Driver Coaching module, GreenRoad Technologies' fleet performance platform, and Omnitracs.
A common pitfall to avoid: rewarding only top performers can lead to a ceiling effect, where those already excelling keep winning, leaving others unmotivated. Schemes that reward progress, letting everyone win by improving no matter where they start, attract more participants and ultimately yield greater fuel savings overall. Some fleets skip incentives entirely, setting speed caps and idle limits in policy and enforcing them with speed control modules, no individual motivation needed.
The range of fuel savings actually reported by fleets and what explains the spread
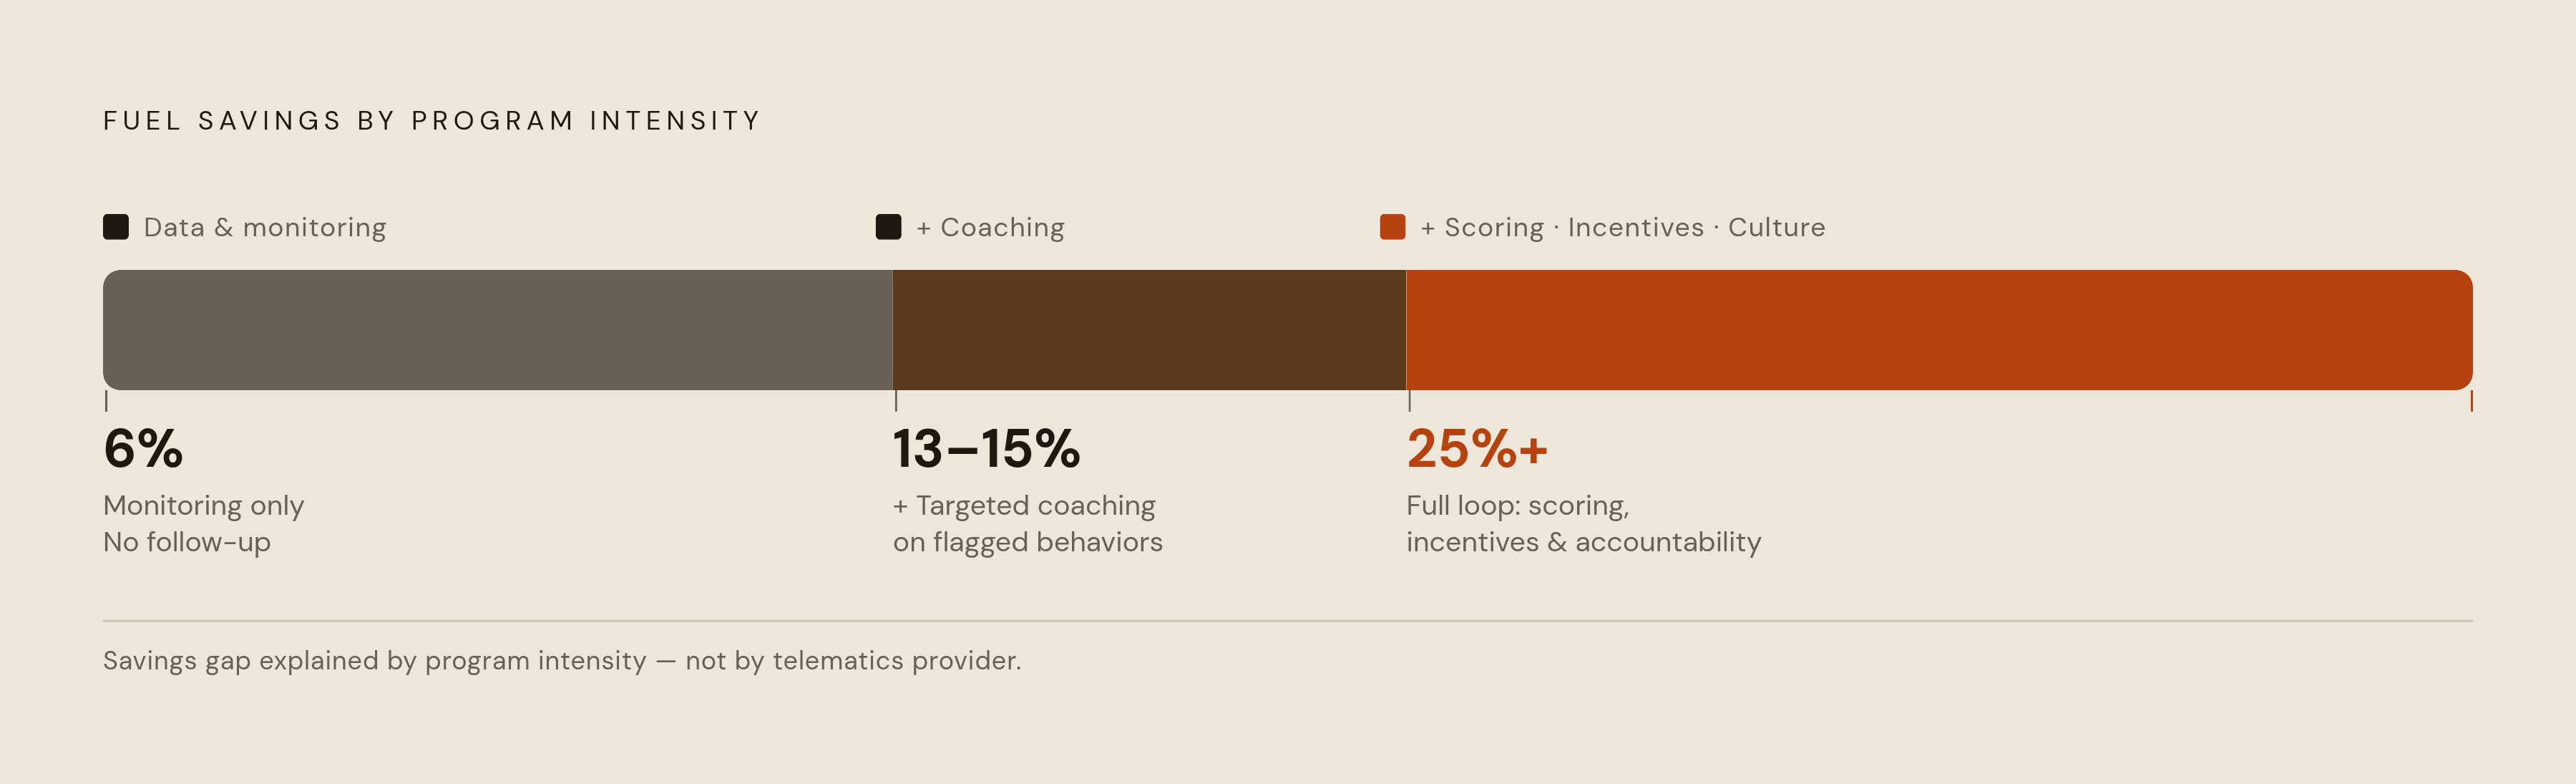
The numbers reported vary a lot, and this variation is meaningful. The U.S. The Department of Energy estimates that better driving habits can save 10% to 15% on fuel. A field test by the FMCSA, using telematics for safety and fuel tracking, showed savings of 6% to 8%. Geotab states that focusing on idling and speeding alone can reduce overall fuel costs by 6%. Fleets that address idle time, optimize routes, and implement driver coaching consistently see 15% to 25% reductions in fuel spend. Driver fuel programs using telematics, AI, and monitoring can cut fuel use by up to 13–40% via better habits and live alerts.
Reducing idling: telematics can cut idle time by nearly 40%, and VehicleTrax users see up to 30% less idling and downtime after using monitoring with driver accountability. Two concrete examples are cited in Geotab's 2025 Sustainability and Impact Report. Tarmac, a fleet operator, reduced idling by 30% in three months, boosting fuel efficiency significantly. Transit operator Autolinee Federico reduced fuel consumption by 20% simply by monitoring driving styles.
Why does the range vary from 6% at the lower end to 25% or higher at the upper end? It's the program's intensity, not the tech provider, that matters. The 6% figures typically appear in programs that just monitor, where a fleet puts in the hardware and does nothing else. The 25%-plus figures appear when monitoring is combined with ongoing coaching, driver scoring, and a real culture of accountability. The technology is the enabler. That's what determines whether a fleet ends up at the low or high end of the range.
The usual ROI timeline for fuel telematics is six to twelve months, so a fleet that gets just the lower end of these savings can cover its implementation cost within the first year.
What fleet managers need to put in place for monitoring to produce results
Begin with an audit of behaviors before launching any coaching program. Identify the drivers and worst habits, like speeding, idling, or slamming brakes, that drain the most fuel. The Pareto principle holds here too: the fastest wins almost always come from the handful of highest-consumption outliers, not from squeezing another percentage point out of drivers who are already efficient.
Align the data's level of detail with how often you coach. Real-time data lets you catch mistakes as they happen, when drivers still recall what they did wrong. Periodic reviews are all that summary reports support, and they change behaviour more slowly. This isn't just a small technical point; it shows the difference between a four-week improvement curve and a program that struggles to gain traction.
Establish policies before implementing the technology. Establish what qualifies as acceptable idle time (30 seconds is often the target for coaching). Create a speed policy you’ll actually enforce, not just one buried in a handbook no one reads twice. And split detention idling from driver idling in the data, because drivers must trust the measurement is fair before they'll accept it.
Create a complete cycle: monitor, coach, score, offer incentives, and repeat. Programs that only monitor, or only coach without recognition, usually lose their initial progress after a few months. The loop is the point. Pairing monitoring data with structured feedback in strategy-first coaching workflows, instead of relying on raw telematics dashboards that no one has time to interpret, significantly reduces the gap between data and behavior correction.
Gauge at two levels, not just one. Fleet-wide MPG gains show managers if the program’s working. Individual scorecard trends show who needs more training and who has earned a bonus. If either level is skipped, the picture remains incomplete.
Driver behavior monitoring that catches poor habits can reduce total fuel spend by 6%. The maximum is 25% or more, and that needs all parts to function together: data, coaching, scoring, incentive, policy. Alone, none of those pieces accomplishes much. They make the difference between a fleet with telematics and one that truly alters driver behavior.