Predictive Maintenance Scheduling for Commercial Fleets
Data patterns catch truck breakdowns weeks before they happen, cutting roadside repairs by half.
Predictive maintenance scheduling fixes two bad habits at once: scrambling for roadside repairs and guessing when to service trucks by the calendar. Sensor data, telematics feeds, and repair history merge into a risk score for each vehicle, and that score, not a mileage sticker on the windshield, determines when a truck is pulled from the road for service. It's not just a monitoring upgrade added to the same old shop floor. It uses a different rule to decide when a vehicle enters service, while fleets on fixed intervals service the calendar, not the truck. That difference is the whole point, and everything below simply backs it up.
Here's what these systems watch for: engine temperature creeping a few degrees over baseline for days on end, oil pressure dipping a little, fault codes trickling in that each seem like nothing on their own. Not one measurement sets off a warning. Together, they signal an alternator about to fail on the side of a highway. A driver who can't see any of it learns the truth only when the dash lights up and the truck quits moving.
The American Transportation Research Institute's 2024 figures put unscheduled truck repairs at more than $15 billion a year for U.S. freight, with a roadside failure costing roughly four times what the same repair would in a scheduled bay. Scheduled maintenance doesn't close that gap either. Sticking to a set 5,000-mile or 90-day plan ignores how each truck was really driven, so fleets service fine trucks too soon and miss bad ones that break down before the next check. Confusing a fixed schedule with a healthy truck is the real error here, not a small slip you can ignore.
What's annoying is we fixed the data issue years back. Intangles reports that over 90% of 2026 vehicles come with built-in telematics. Nearly every new truck already sends the signal. Most fleets still lack the setup to act on that signal before a breakdown happens.
What the data pipeline actually looks like, from sensor to risk score
Every day, a commercial truck generates a massive stream of raw data: CAN bus and J1939 signals, OEM telematics feeds, diagnostic trouble codes, engine hours, mileage, GPS and route history, fuel or energy use, tire pressure and temperature, coolant and oil readings, battery stats where applicable, driver behavior events, and the full repair log. The bulk of it is noise, or just repeated proof that all is well. Filtering has to happen before any prediction works, and fleets that skip it leave their analysts buried in routine engine-hour logs from a thousand healthy trucks.
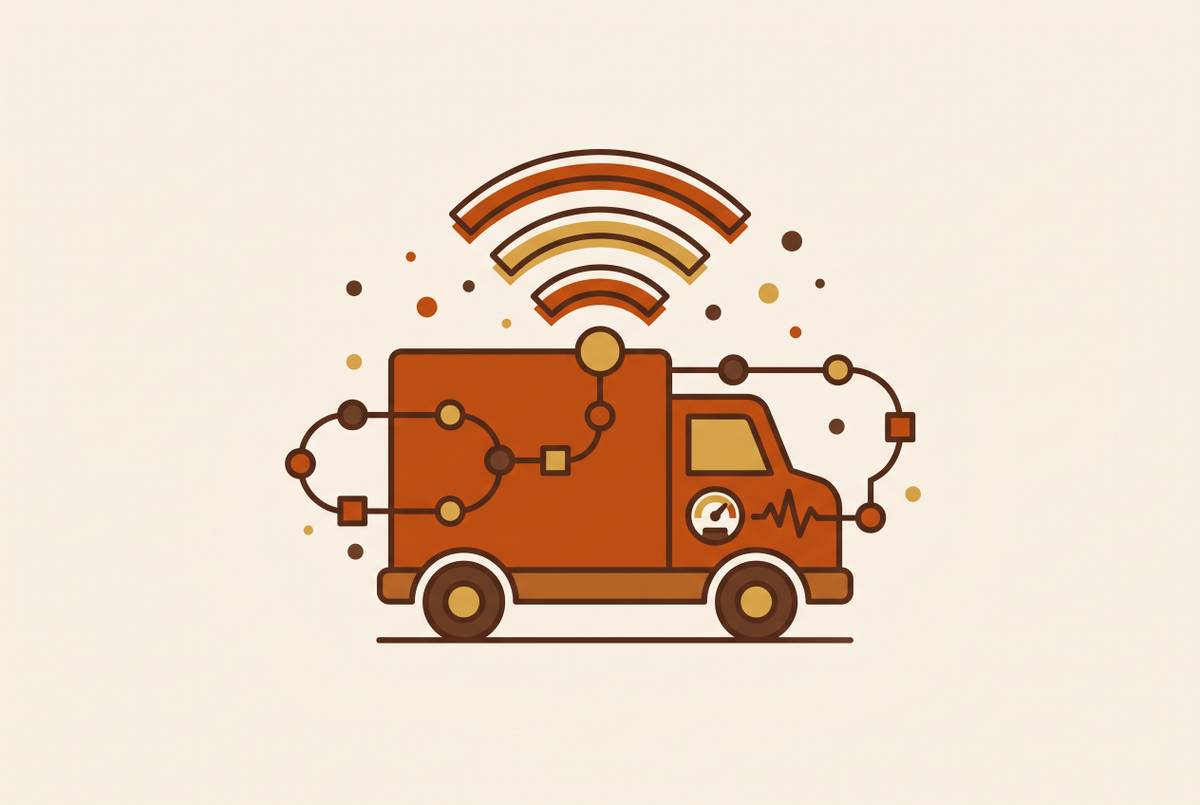
The filtering happens on the device, not in the cloud. Telematics gateways on the vehicle run an initial check on-site, marking anomalies before any data is sent. This trims delay and leaves the cloud working only with data that really counts.
When the data hits the platform, the actual job begins: putting together a baseline. This isn't the factory's spec sheet. It's how "healthy" appears for this truck, on these routes, carrying these loads, in this climate. Even built on the same line, a local drink truck sitting in city traffic wears out differently than a refrigerated long-haul rig cruising the interstate. Calibrating to how a given vehicle itself operates takes several weeks once it's deployed, and until that baseline sets, predictions stay rough. Fleets wanting precise answers in week one are making the system guess.
Once the baseline is set, the system monitors for deviation. If current readings stray from that vehicle's usual pattern, the system keeps recalculating its chance of breaking down. Every vehicle in the fleet has a live health score instead of a simple pass or fail.
The P-F curve from reliability engineering helps frame this. The curve maps how much time passes between a fault first becoming visible and a real breakdown occurring. Condition monitoring holds back until a threshold is crossed, so it ends up spotting the curve late. Machine learning models spot problems sooner by forecasting how wear will progress rather than waiting for a limit to be breached, and catching it early is what changes a major breakdown into a planned repair. Every fleet has its own mix of routes, loads, drivers, and climates, so a model may need calibration to a specific fleet’s data. It only gets accurate once it learns from this fleet's own data.
The ML models doing the pattern recognition, and what each one contributes
In production predictive maintenance systems, three model families shoulder most of the load, and each one is there for a distinct reason, not as a duplicate.
Random Forest models spot fleet-wide wear patterns and part-specific decline trends. By averaging many decision trees, the method avoids locking onto a single truck's oddities, which fits fleets where vehicles do very different work. Neural nets catch the subtle patterns: the non-linear, multi-signal combinations that no single threshold could spot alone. A small uptick in exhaust temperature, a small dip in fuel efficiency, and a certain fault code might each mean nothing on its own, yet a trained network can spot them together as an early warning of turbo failure. Time-series models, including LSTM networks and ARIMA, follow how a part's condition changes over time, fitting wear-driven failures such as brake pad thinning, tire tread loss, and drivetrain fatigue.
Production systems rarely use just one of these. Published figures show predictive maintenance systems can achieve high precision on failures in bearings, pumps, motors, and alternators.
What really determines if technicians trust the system, though, is the false positive rate, and it counts for more than raw accuracy ever will. Haul a working truck in twice because of a false alarm, and whoever did the inspection quits trusting the dashboard. Adoption stalls after that no matter how good the underlying math is. Fleets usually figure this out the hard way, often by the third false alarm rather than the first.
Prediction horizon matters just as much as accuracy. Right now, these models spot likely breakdowns three to eight weeks ahead, giving maintenance managers enough time to fix things during scheduled downtime rather than calling a tow truck at 2 a.m. They get better the longer a fleet uses them, because every round of actual failures and repairs tunes the system.
What sets this apart from a technician checking a dashboard is correlation, not one reading alone. Coolant temperature over baseline tells you almost nothing on its own. Mix in the load weight and that day's ambient temperature, and the pattern either shows normal variation on a heavy summer haul or signals a cooling system beginning to fail. Someone reading gauges one by one will almost always miss that link, not from sloppiness, but because eyes can't compare five variables at once.
How the risk score becomes a scheduled service window
A risk score left in an unchecked dashboard does nothing, and many early predictive maintenance rollouts failed for that reason. Depot return schedules give trucks and buses only narrow windows for maintenance, so pulling one at the wrong time, mid-route, mid-shift, right before a delivery deadline, costs something even when the repair itself is cheap.
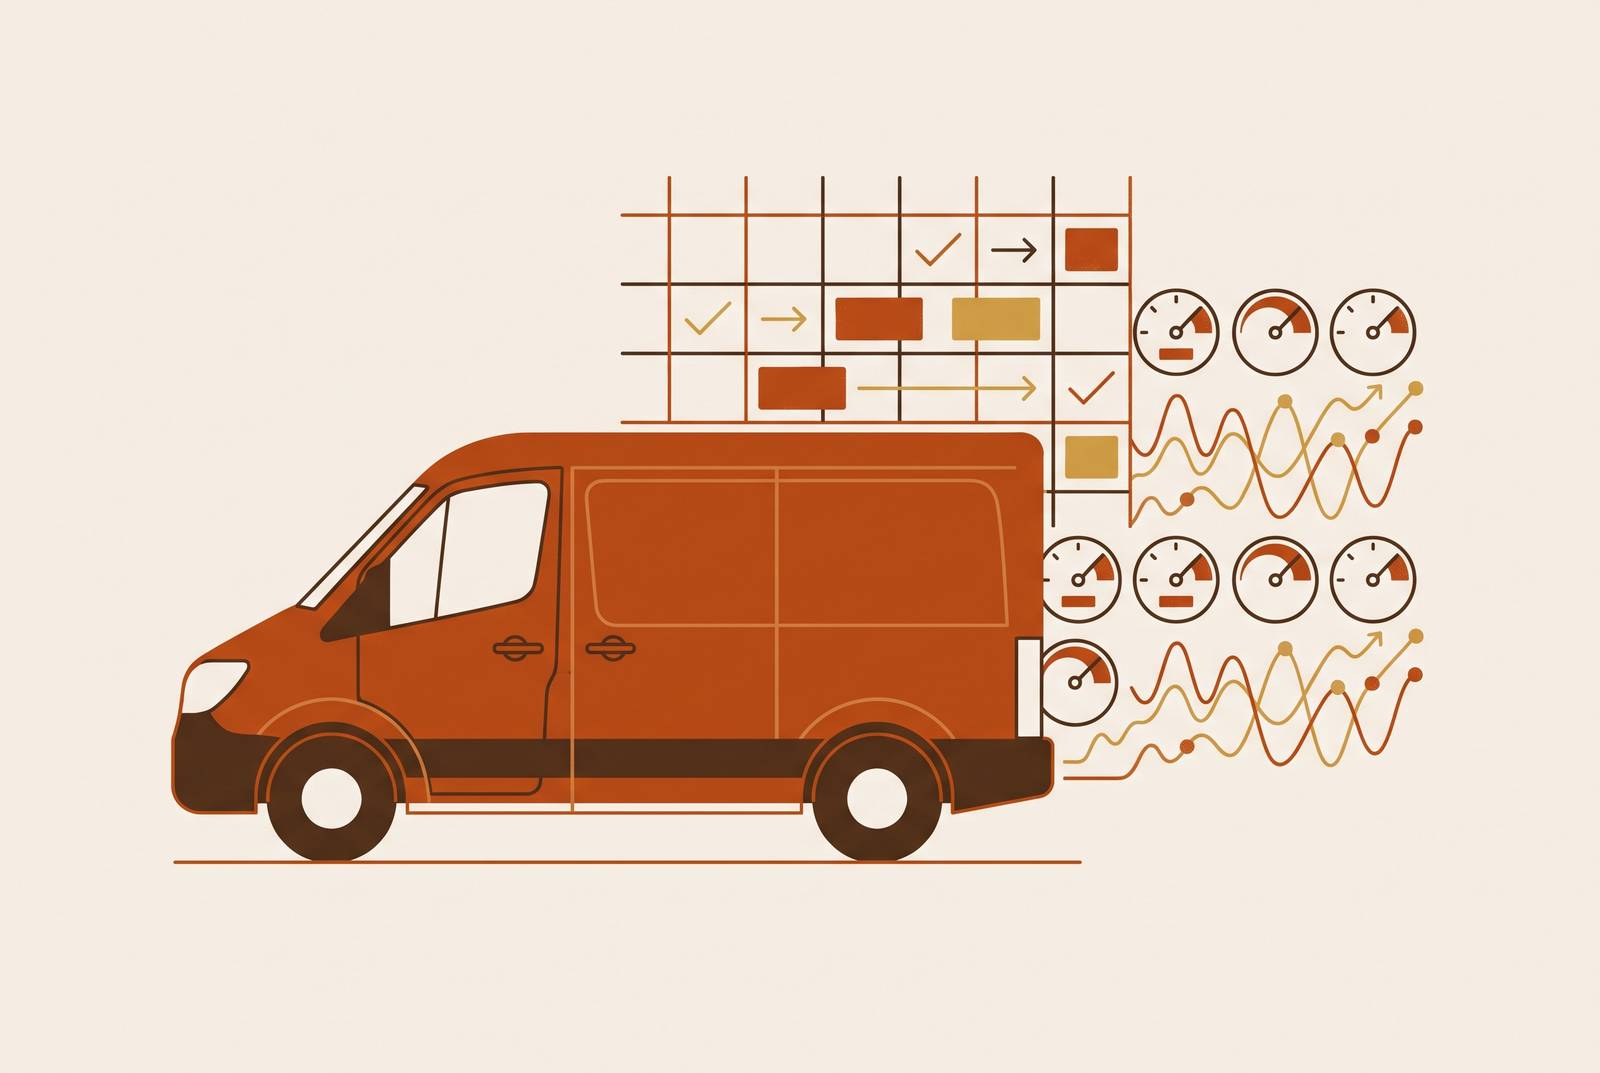
Predictive Maintenance 2.0, as it's often called, moves from just alerting to actually taking action, and most buyers don't give it enough weight when they're comparing dashboards. Intangles says current-generation systems create the work order, book the technician, and match parts to inventory before a driver spots any problem. Once a risk threshold is crossed, the system automatically creates a prioritized work order, sends it to an available technician, and schedules the repair without disrupting the day's routes.
Whether the parts are on hand is what really decides if this works. Even the best-timed service window means nothing when the truck's water pump sits three days away on backorder. Systems that truly close the loop connect to parts inventory, so procurement kicks off as soon as the risk score passes threshold, working alongside scheduling rather than waiting for a technician to open the hood and see what's needed.
For a maintenance department, the real change goes deeper than most software pitches admit. Reactive crews start each day sorting out which dead truck is the biggest problem, which gets a bay first, and which sits. Predictive shops pose another question instead: which still-working truck needs work, and how soon. That's planning, not firefighting, and each needs different people running it day to day.
Beyond prediction lies what researchers call prescriptive maintenance: the algorithm not only forecasts the failure but plans, and sometimes controls, the fix. You won't find it in most commercial setups yet, but the field is moving that way.
This pattern has been observed in fleet operations. The system caught trucks with sensor patterns indicating potential component failure. Work orders were generated, and repairs were completed before breakdowns occurred. That whole run, turning raw signals into booked repairs before anyone had to notice the trend, is predictive maintenance's full promise in a single example.
What real fleets have saved, and what the numbers actually represent
Every savings number below comes from closing that same 4x gap between roadside and scheduled repair costs. Keep that baseline in mind: it's why these numbers exist, and stay skeptical of any case study that doesn't tie back to it.
Several customer results illustrate the benefits of predictive maintenance. Some fleets report significant savings from predictive maintenance. Certarus says it saved $500,000 in maintenance costs. Some fleets have reduced costs by improving asset utilization. Some school bus fleets have increased vehicle uptime and reduced maintenance costs. on a tight school bus budget.
Geotab's customers tell the same story another way. With Geotab’s telematics solutions, Swift Ride cut costs by $400,000 a year. After adopting Geotab’s predictive maintenance tools, Some fleets have seen improvements in driver safety and cost savings., showing that predictive maintenance overlaps with driver behavior monitoring more than the category name suggests.
Those numbers don't show the full picture of what shifts. Technician hours once spent guessing at diagnostics can go to real repairs instead. You keep a customer instead of dealing with a third breakdown in one quarter. A vehicle remains compliant rather than being removed from service during a DOT inspection. These benefits won't appear on any savings sheet, yet they're genuine avoided costs, and in truth they matter more than the big dollar numbers vendors love to promote.
Where adoption actually stands, and why the gap between intent and deployment persists
68% of fleet managers say AI-driven predictive maintenance is a priority, but just 27% have rolled it out. The real story here is that gap, not the models, and why it’s so wide is worth examining.
A survey of over 600 fleet pros in the Fleetio 2026 Fleet Benchmark Report showed 53.3% of fleets exploring or testing AI, but just a few are using it widely. Most fleets, put simply, are at the pool's edge, not in the water.
Some of the delay comes down to structure, not a lack of trying. Limited access to OEM diagnostic data, plus the expense of connecting new AI platforms to legacy fleet management systems, rank as top market restraints, per Global Market Insights. A telematics platform can only forecast from visible data, and many OEMs still block access to deep engine diagnostics. Fleets aren't using that as a cover. It's an actual limit.
The technician shortage puts pressure on fleets that they can't overlook for long. More than 30% of diesel technician jobs are open right now, and 42% of those technicians still working say they'll retire by 2028. Fleets can't recruit their way out of this, so AI-driven maintenance productivity shifts from nice-to-have to nearly structurally necessary. Soon, there won't be enough people to keep fixing things only after they break.
Cloud deployment has at least removed one obstacle. Cloud solutions account for 66% of the market now, and SaaS pricing does away with the upfront infrastructure costs that once priced predictive maintenance out for all but the biggest national carriers.
The cold-start problem is still real, though. Fleet-specific baseline learning needs weeks to stabilize, and fleets must accept a ramp-up period before predictions become operationally reliable. If a maintenance director wants results right away, they'll write it off before the models finish tuning, and that's on management, not the tech.
Fleets already using these systems keep building fleet-specific training data that sidelined fleets don't have, and every quarter that gap goes unaddressed, it grows. Waiting doesn't preserve optionality here. It just costs ground.
The added complexity of mixed powertrains and EV-specific monitoring
In 2026, most fleets use mixed powertrains, with diesel and electric vehicles together, so a predictive maintenance platform must handle both without making a maintenance team manage two systems. A system that fails here isn't just incomplete. It's a ticking liability, with EV share only climbing from here.
EV monitoring differs from internal combustion in more ways than just changing sensor types. Battery state of health has to be tracked continuously, not at the periodic checkups that suit an engine fine. Charging session data shows wear patterns in the charge curve long before a driver sees reduced range on the road. Inverter health is a completely new failure mode that has no combustion-engine equivalent, so it needs its own dedicated model instead of a patched adaptation of an existing one. Intangles cites 2024 and 2025 NREL research showing machine learning models forecast battery wear much faster than standard aging tests.
EV battery detection spots degradation 60 to 90 days before it becomes measurable range loss, giving you more lead time than most combustion-engine failure predictions. It gives fleets a genuine jump on booking battery service ahead of a driver calling in about lost range mid-route.
Compliance runs through all of this, no matter the powertrain. Predictive maintenance tools build organized service logs on their own, helping fleets meet 49 CFR Part 396 and lowering the chance a DOT inspector puts a truck out of service. Given the liability at stake, it's nearly non-negotiable.
If a system tracks combustion-engine sensors closely yet lacks a true battery state of health model, it builds its own blind spot, one that widens as the fleet's EV share rises. Picking the cheaper system now means betting against what your fleet will look like later, and that bet only gets worse with time.
What to look for in a predictive maintenance platform, and where the major options differ
Check diagnostic depth before comparing feature lists, because it limits everything that follows. Samsara tracks about 1,000 diagnostic codes, but Geotab watches over 5,000. A platform's visibility limits its predictive potential, making this gap more crucial than most marketing copy suggests. A fleet that buys on brand alone never asks the one question that really decides outcomes, and that's a bad corner to cut.
Frost and Sullivan named Geotab 2025 North American Company of the Year in Commercial Vehicle Fleet Management. Its open API setup lets fleets hook in third-party tools, the same arrangement that gave Swift Ride its $400,000 in yearly savings via Geotab Keyless, the GO9 device, and custom API integrations. Richards Building Supply saw safe driving behavior jump 41% in 60 days using Geotab's Vitality product, saving an estimated $190,000. Its deep diagnostic code coverage lets it make finer, component-level predictions than a shallower system can, and for fleets running complex mixed equipment, that depth decides it.
Samsara's published customer results show comparable strength from a different technical base: Maxim Crane Works saving $13 million a year, Certarus at $500,000, Interstate Waste Services at $240,000, and Garden City Public Schools with a 20% uptime gain and 66% cut in maintenance costs. Samsara reads about 1,000 diagnostic codes, fewer than Geotab but enough to spot the main breakdowns most fleets face. Its fleet maintenance product uses telematics data to create work orders directly.
Pick based on what the fleet really needs to spot, not the brand name. Fleets with complex mixed equipment, older assets, or specialty vocational trucks need Geotab's deeper code coverage. Fleets with a simpler, more uniform mix of assets can get by fine with Samsara's narrower coverage, which offers tighter work order integration for that scenario. Choosing the more familiar name without checking which failure modes it detects leaves fleets with a sleek dashboard that still misses the alternator.
The OEM data access problem affects every vendor comparison and isn't tied to one platform. Ask directly which OEM diagnostic feeds a given platform has actually negotiated access to. Sales brochures downplay how much that answer changes, and most buyers don't think to ask until they've already signed.
Bosch, Continental, Microsoft, Samsara, and Siemens, the five biggest players in predictive maintenance for vehicles, held 43.03% of the market between them in 2024. That leaves more than half the market shared among specialist providers and integrated fleet management platforms, so vendor differences can really matter.
How to move from a reactive maintenance program to a deployed predictive system
Run a data readiness audit before any platform demo. See which fleet vehicles already send the signals a predictive system needs. Since over 90% of vehicles built in 2026 come with embedded telematics, most of a modern fleet likely needs no extra hardware, though older assets may need retrofitting to take part at all.
Start by nailing down the real scheduling constraint the platform has to work around. When trucks return to the depot, when drivers work, and when routes run all determine whether a service chance exists at all, and that data must come from fleet operations, not a software setup screen. A platform can't optimize a service window it doesn't know exists, no matter how good its model is.
Plan on two to four weeks to set the baseline after launch, and warn the maintenance crew early, before any alert goes off. Vehicle-specific models need that ramp time to get properly calibrated, and a team expecting sharp predictions on day one will misjudge what the system's worth before it has learned the fleet's own patterns.
Next, test the full cycle, risk score to automated work order, on part of the fleet before expanding it company-wide. Keep a close eye on false positives at this point, because that figure decides whether technicians will trust the system enough to follow its recommendations. A platform that's accurate but not trusted in daily use does nothing, and ensemble modeling won't fix a technician who's stopped reading the dashboard. Expand it only after you've built that trust, one right prediction at a time.