Route Optimization Software for Last-Mile Delivery Fleets
Smart routing cuts the cost chains that make last-mile delivery expensive.
Last-mile delivery now eats up 53% of total shipping costs, up from 41% back in 2018. I've spent enough years around fleet operators to know that number keeps climbing every time someone recalculates it, and this piece is about the software fleets buy to fight that trend. More specifically, it's about telling apart the features that actually cut cost-per-delivery from the ones that just look nice in a sales deck.
U.S. delivery costs rose about 12% from 2024 to 2025 alone, so the squeeze isn't letting up. The question worth chewing on is which parts of route optimization software do real work, and which parts are just decoration hung on the side of a truck.
The specific failure modes that drive up cost-per-delivery
Start with the ugliest number in the business: about 5% of deliveries fail on the first try, at an average cost of $17.78 per package. Address errors cause 45% of those failures, which would almost be funny if someone weren't paying for the same package twice. Tack on reship costs, customer support calls, and the slow drip of customers who quietly stop ordering from you, and a single failed delivery runs $15 to $40 in total damage. First-attempt success rate is probably the single highest-leverage number a fleet operator can move, because every point gained there kills off a whole chain of downstream cost before it starts.
Then there's empty miles: 16.7% of all miles driven in 2024 made zero revenue. That's almost one in six miles burning fuel and driver hours for nothing, usually because a route got sequenced badly or a truck rolled out of the depot half-full.
There's also a cost that never shows up on a P&L but shows up everywhere else. Last-mile delivery accounts for roughly 54% of the transport sector's emissions and around 13% of total city emissions. Regulators and ESG scorecards are starting to price that in, whether your finance team has a line item for it or not.
Here's the part that makes this compound instead of just add up: these failure modes feed each other. A failed delivery triggers a redo, and the redo adds miles. Those miles burn fuel and driver hours, and labor is already about half of last-mile expense before you factor in the do-over. So when you look at a piece of software, the real question is whether it interrupts one of these chains before it starts, or whether it just reports on the chain after the fact.
What route optimization software actually does under the hood
Strip away the marketing copy and the core function is almost boring: the software checks a huge number of possible stop sequences against real constraints, delivery windows, vehicle capacity, how many hours a driver has left on shift, current traffic, and picks the cheapest sequence that still works.
The distinction that actually matters is static versus dynamic. Older tools solve the route once, at 6 a.m., and that's the plan for the whole day, cancelled orders and traffic jams be damned. Modern engines re-optimize as the day unfolds, adjusting when orders get cancelled, new ones come in, or a driver calls in sick. On top of that sits a learning layer: the system tracks which routes drivers actually accept versus override, where delays cluster, which delivery windows carry the most risk of a missed attempt, and it uses that history to get sharper instead of running the same static logic on repeat forever.
One quiet but real shift: an estimated 72.4% of 2025 market revenue in this category runs through cloud-based, SaaS deployment. In practice that means faster setup, updates that happen without a six-month IT project attached, and pricing that scales per route instead of demanding one big upfront license. None of that shows up on a feature list, but it changes how fast you actually see any value.
So here's the honest takeaway: you cannot read a vendor's algorithmic depth off a comparison chart. Ask directly how many constraints the engine juggles at once, how often it re-optimizes, and what exactly the learning mechanism is learning from. If the answer is vague, that vagueness is itself the answer.
The four capabilities that operationally move the needle
Multi-stop sequencing and load optimization comes first, mostly because everything else sits on top of it. The order a driver hits stops in determines total miles, idle time, and how full the truck is before it even leaves the lot. Good sequencing factors in vehicle load limits, time windows, and how stops cluster geographically, not just shortest-path math from point A to point B. UPS's ORION system is the industry's favorite proof point here: it weighs package details, live traffic, and even parking to deliver meaningful per-driver mileage reductions at scale. Subsequent dynamic upgrades have extended those gains further, which amounts to a fleet-wide behavior change rather than a minor tweak.
Real-time re-routing comes next, and buyers clearly agree it matters, consistently ranking it among the most important capabilities in platform evaluations. Makes sense once you think about it, since a route planned at 6 a.m. is stale by 9, because traffic shifted, a customer wasn't home, or three new orders landed. The real difference between platforms is whether the system adjusts on its own or just flags a problem and waits for a dispatcher to notice it buried in a queue. During high-volume surges, automatic re-optimization is what allows carriers to absorb demand spikes without proportionally expanding their fleets.
Driver app integration is easy to overlook because it isn't glamorous, but it's where a lot of good optimization quietly dies. A perfectly sequenced route means nothing if it doesn't reach the driver in a usable, live format, and plenty of older dispatch setups still have that exact gap. What actually matters: turn-by-turn navigation synced to the optimized order, proof-of-delivery capture, exception reporting when a driver hits a locked gate or nobody home, two-way messaging with dispatch. A chunk of first-attempt failures is really just a data problem: a driver without clear access instructions leaves a card on the door, and that one small gap kicks off the $15-to-$40 cascade from earlier. Worth asking any vendor point-blank: when a route re-optimizes mid-shift, does the driver's app update by itself, or does someone have to remember to hit refresh?
Analytics and delivery intelligence closes the loop, and real-time monitoring consistently ranks as a top priority among enterprise buyers. This layer covers on-time rate by route, driver, and territory, first-attempt success, stop dwell time, idle time, the whole diagnostic picture that tells you where the money is actually leaking. Predictive scheduling is becoming standard too: predictive scheduling is becoming standard among top online retailers, used to tie customer delivery windows to actual route progress instead of a static guess set that morning. Without this layer, an operator can plan and re-plan all day and still have no idea which routes or drivers are quietly driving cost up.
How to read vendor benchmarks and ROI claims
Vendor literature throws around a wide spread of numbers: fuel cost cuts of 10 to 30%, operating cost cuts of 10 to 20% cited in research on analytics-based transportation optimization, first-attempt success gains tied to live routing AI. All of it shows up somewhere in the marketing, usually on the same slide.
The spread itself is worth sitting with for a second. Fuel runs about 21% of total operating cost for the average U.S. motor carrier in 2024, so a 10% fuel saving means something very different depending on your fleet's actual cost structure. The number scales with your baseline, it isn't a fixed dollar figure, and vendors rarely walk you through that math unless you make them.
One real case worth naming: Svuum, a Greek last-mile carrier, partnered with FarEye in 2025 and reported a 50% cut in operational costs alongside a 95% first-attempt delivery rate. Those are genuinely strong numbers, but fleet size, the tech stack they were replacing, and their delivery geography all shape how much of that outcome transfers to a different operator running a different city.
So ask blunt questions before you believe a slide. What's the baseline the savings are measured against, manual planning, a legacy system, or some modeled counterfactual nobody can actually check? What time horizon is baked into that ROI number? And how much integration effort is quietly assumed inside it? One line worth flagging on its own: companies with mature integration strategies report up to 20% lower operating costs, and "mature integration" is doing an enormous amount of work in that sentence. Implementation quality is a variable, and it's usually the buyer's variable to manage, not the vendor's.
One red flag worth remembering: any savings claim that doesn't specify the constraint set it was solving against, stop count, time window tightness, vehicle mix, isn't really comparable across fleets. It's a number floating with no anchor attached to it.
EV fleets and the constraint complexity that changes route planning
Electrification is moving fast. Electrification is advancing across fleet operations, with growing numbers of operators already running EVs and more planning to expand their electric capacity in the coming years.
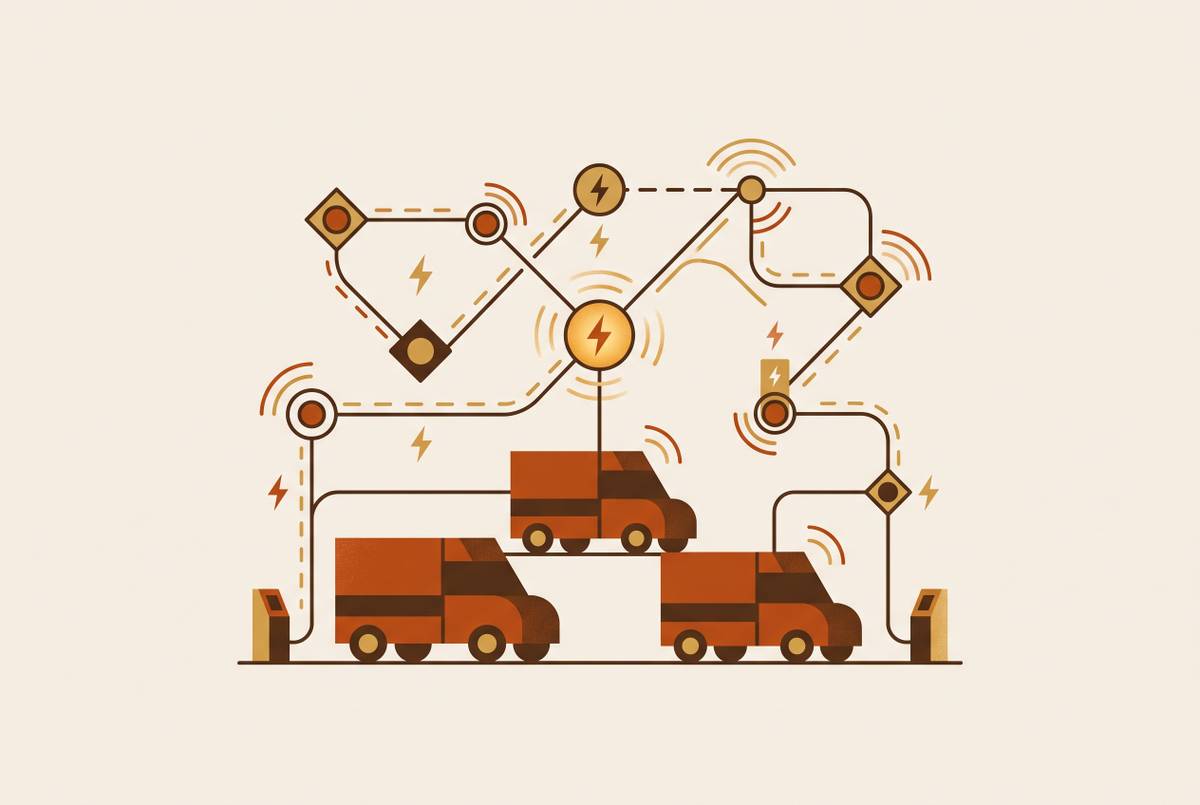
Here's where the math actually gets harder: range becomes a hard constraint that diesel routing never had to think about. Routes now need to account for charging station locations, how long a charge actually takes, and a vehicle's real-time state-of-charge. None of that existed in the old constraint set, and bolting it on after the fact rarely works cleanly.
Range anxiety and charging logistics can turn a mathematically perfect route into one a driver simply can't execute, because the truck runs dry two stops before the depot. Software that doesn't model EV constraints natively hands you routes that look great on a screen and fall apart on the actual road.
The upside case is real, though. The Netherlands got parcel emissions down to 100 grams of CO2 per parcel in 2024, down from 230 grams in 2018, a 56% cut, by combining fleet electrification with route optimization at national scale. So if electrification is anywhere on your roadmap in the next three to five years, ask a vendor now whether their constraint engine already handles EV variables, or whether that's a retrofit they're planning to build after you've already signed.
Leading platforms and what differentiates them operationally
The market itself is sizeable and moving fast: estimates for 2025 range from $7.6 billion to $8.86 billion depending on scope, with projections putting it well above $15 billion before 2030. That's room enough for several vendors to compete on different strengths rather than one platform winning everything.
Locus leans enterprise, with tooling oriented toward automatic re-optimization as conditions shift through the day and a track record positioned around large-scale enterprise deployments spanning multiple countries. Best fit: large, multi-country fleets with genuinely tangled constraint environments.
FarEye builds its pitch around delivery experience alongside route efficiency, and the Svuum case, that 95% first-attempt rate and 50% cost cut after digitizing logistics, is its strongest public proof point. Best fit: operators who weigh customer-facing metrics like live tracking and delivery notifications about as heavily as raw cost.
Upper shows up often in SMB and mid-market comparisons, generally positioned at a lower price point than enterprise-tier platforms. Best fit: smaller fleets without a dedicated logistics engineering team, looking for speed to value over deep customization.
Elite EXTRA is oriented toward the U.S. market, with reported emphasis on last-mile and final-mile work. Research on mature integration strategies suggests companies can see up to 20% lower operating costs and positive ROI within 12 months. Best fit: regional fleets in distribution or specialty delivery, parts suppliers, food service, that need tight integration with an existing ERP or order management system.
NextBillion.ai takes a different shape from typical standalone platforms. Best fit: tech-forward operators or third-party logistics providers who want optimization logic integrated into their existing tools rather than a full system replacement.
Which platform fits depends on constraint complexity, fleet size, what you need to integrate with, and whether real-time re-optimization or analytics depth matters more to how you actually run the operation.
A practical evaluation framework before signing a contract
Start before any vendor call, and define your own cost baseline first: current cost-per-delivery, first-attempt success rate, empty miles percentage, average miles driven per driver per day. Those four numbers tell you what a platform actually needs to move. Skip this step and every ROI claim a vendor makes becomes unverifiable, which turns the whole buying process into feature theater dressed up as due diligence.
Next, map your constraint environment honestly. Stops per route, vehicle types, how tight your time windows really are, whether you run multiple depots, your current EV mix, what you need to plug into on the WMS, TMS, or ERP side, all of it belongs on the list. That list alone knocks out half your options before a single demo eats up anyone's afternoon.
Then insist on a proof of concept using real historical routes, not a canned demo built to impress. Ask the vendor to optimize a week of your actual past routes and compare what it planned against what actually happened out on the road. Track planned miles against miles really driven, planned stops against completed stops, and how often drivers accepted the suggested sequence versus just overriding it and doing their own thing.
Check integration depth too, not just whether an API technically exists somewhere in the documentation. Confirm, don't assume, that the driver app updates on its own when a route re-optimizes mid-day, and confirm the analytics plug into whatever reporting stack your dispatchers and finance team already use, rather than living in some separate dashboard nobody remembers to open.
Last, be honest with yourself about implementation cost. The gap between a vendor's promised ROI and what you actually get usually lives in implementation quality, driver adoption, dispatcher retraining, and whether the data feeding the system is reliable from day one. Ask for references at your fleet's size and complexity, not just the biggest logo on the case study page; a 2,000-truck enterprise reference tells you very little about how the software behaves for a 40-truck regional operator.